Fixing a Memory Leak in a Ruby SideKiq Job
I was recently tasked with finding an fixing a Ruby memory leak. Knowing nothing about Ruby, this was quite a challenge! It seems quite likely that other people will run into a similar problems in the future, and I hope that by writing this article with all the relevant buzzwords I will be able to SEO myself into those peoples laps.
In short: we were using RequestStore in a long-running sidekiq job. During this job the store grew and grew until we ran out of memory, then the job would crash. We started clearing the RequestStore, and that fixed the problem.
The setup
At Contentful, where I work, we have a Ruby monolith. It is one of the oldest service that we have, with a lot of responsibilities, a lot of accumulated features. And because we are now mostly a Node.js company, it's generally seen as a 'scary old thing', left to specialised Ruby developers.
The service contains various Sidekiq jobs. The particular job we're concerned with here runs once a day, and is meant to iterate through every 'Space' that exists in Contentful. For each of these 'Spaces' it checks that we have correct infrastructure backing it, and if we don't, fixes the problem. The job was temporarily disabled late last year, and upon being re-enabled we noticed that it was always crashing with an Out Of Memory error before finishing. This was a problem, because we really wanted the job to finish!
Initially we assumed that the job just didn't have enough memory assigned, so we gave it some more memory. It keep crashing but took slightly longer. I looked at the memory usage. It looked like this:
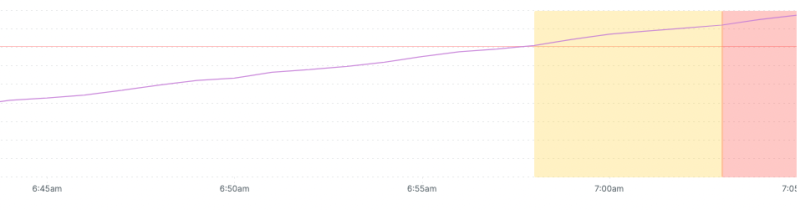
Not good.
On not knowing Ruby
I am not a Ruby developer. I don't know the language, the ecosystem, or the tooling. This put me in a slightly difficult position, where I barely knew how to start debugging a Ruby program. Let alone how to find a memory leak.
I spent a while quizzing people and reading up on memory in Ruby, trying to understand what tooling I could use to run this job in a way that would alow me to observe how the memory usage evolved in real time. As I did this it became clearer and clearer that my lack of familiarity with the ecosystem was meant that any 'serious' debugging attempt was going to take a lot of work. My life's ambition is not to become a Ruby developer, so this seemed like a poor use of time.
Instead I decided to take the traditional approach and just read all the relevant code. A technique that for me has a much higher success rate than using debugging tools, but probably only because I continually find excuses to avoid learning how to use them properly.
The problem
After an hour or so I had followed all the threads, and the only thing I could find that looked suspicious was one of our code paths that used something called RequestStore. It sounded suspicious because this is a cronjob, and does not deal in 'Requests'.
RequestStore is, it turns out, a popular Ruby library for caching data for the duration of a request. It's built with rails in mind, and gives you a key value store on a per request basis with which you can save and access arbitrary data across your code-base. A key feature is that this store is cleared when that request ends. You can use it to, for example, cache the result of a computationally expensive query that might otherwise be made in several places during the life-cycle of one request.
There is one very obvious problem with using RequestStore in the context of a long running cronjob: there's no request to end. Therefore there is nothing to trigger clearing the cache.
So I changed our code to manually clear the RequestStore after each iteration of the job and deployed this new version to staging. Here is how the memory usage now looked:
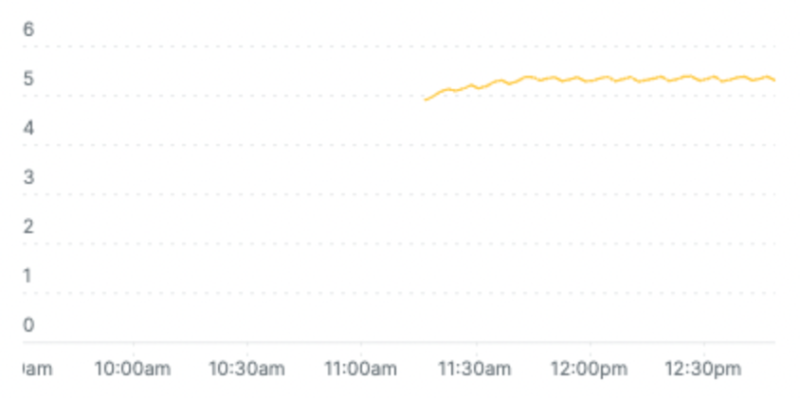
Much nicer!
Conclusion
If you have a long running ruby process that has a big old memory leak, have a look to see if you're using RequestStore!